Student Achievement Data Discovery Dashboard
VIEW THE STUDENT ACHIEVEMENT DATA DISCOVERY DASHBOARD
The Louis Riel School Division's (LRSD) Data Discovery Dashboards allow the public to interact with data on student achievement. The public-facing web-based tool attempts to make data accessible and understandable to everyone in the LRSD community.
The Data Discovery Dashboard was created by LRSD using Power BI, an analytics application by Microsoft that allows users to create an easy-to-navigate visual display of data. The Student Achievement Data Discovery Dashboard illuminates the effects of socio-economic status (SES) and the division's Greatest Areas of Need (GAN). By clicking through the various pages of the Student Achievement Data Discovery Dashboard, individuals can isolate data based on skill, gender, grade level and more.
The division has been measuring the impact of the strategic priorities related to student learning and well-becoming outlined in its Multi-Year Strategic Plan. The Student Achievement Data Discovery Dashboard is a high-level summary of that measurement and presents the progress of future-ready skills among learners. The data show the percentage of students in grades 1 to 8 who scored a 3 (good) or 4 (very good or excellent) on the final term of the provincial report card and students in grades 9 to 12 who achieved a final mark of 70% or higher in core courses.
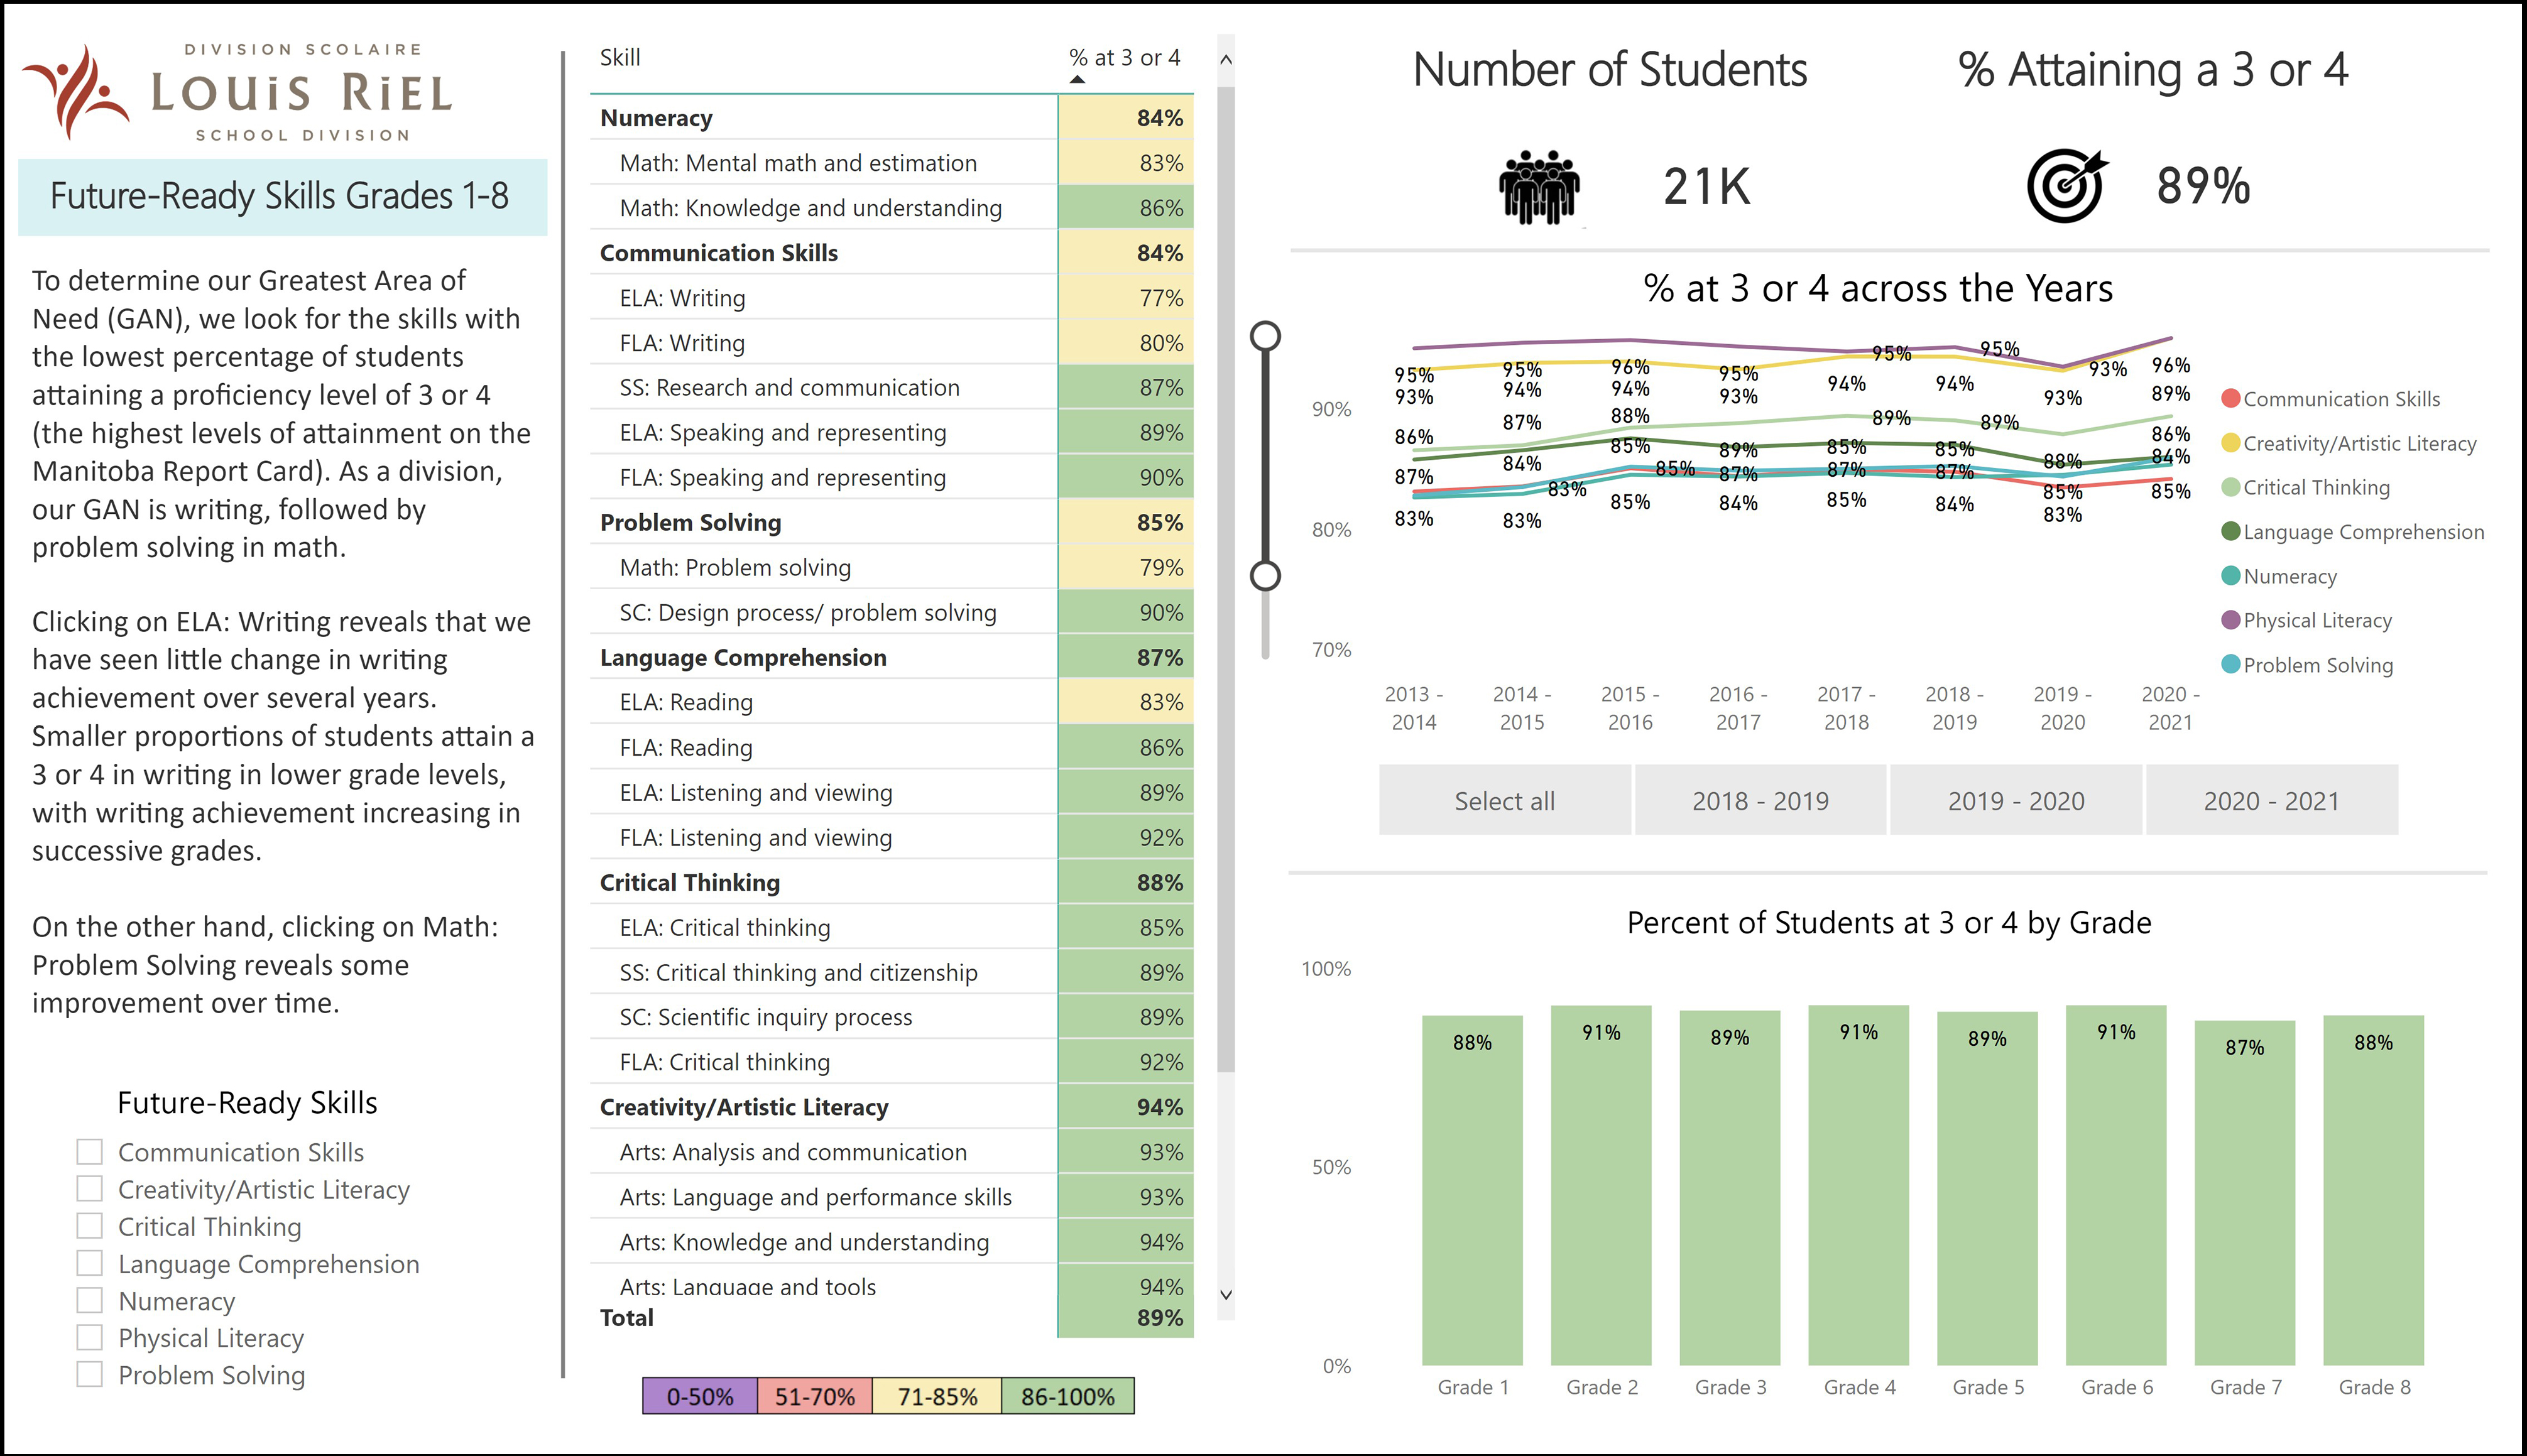
Grades 1 to 8 Future-Ready Skills
To determine our Greatest Area of Need (GAN), we look for the skills with the lowest percentage of students attaining a proficiency level of 3 or 4 (the highest level of attainment on the Manitoba Report Card). As a division, our GAN is writing, followed by problem-solving in math.
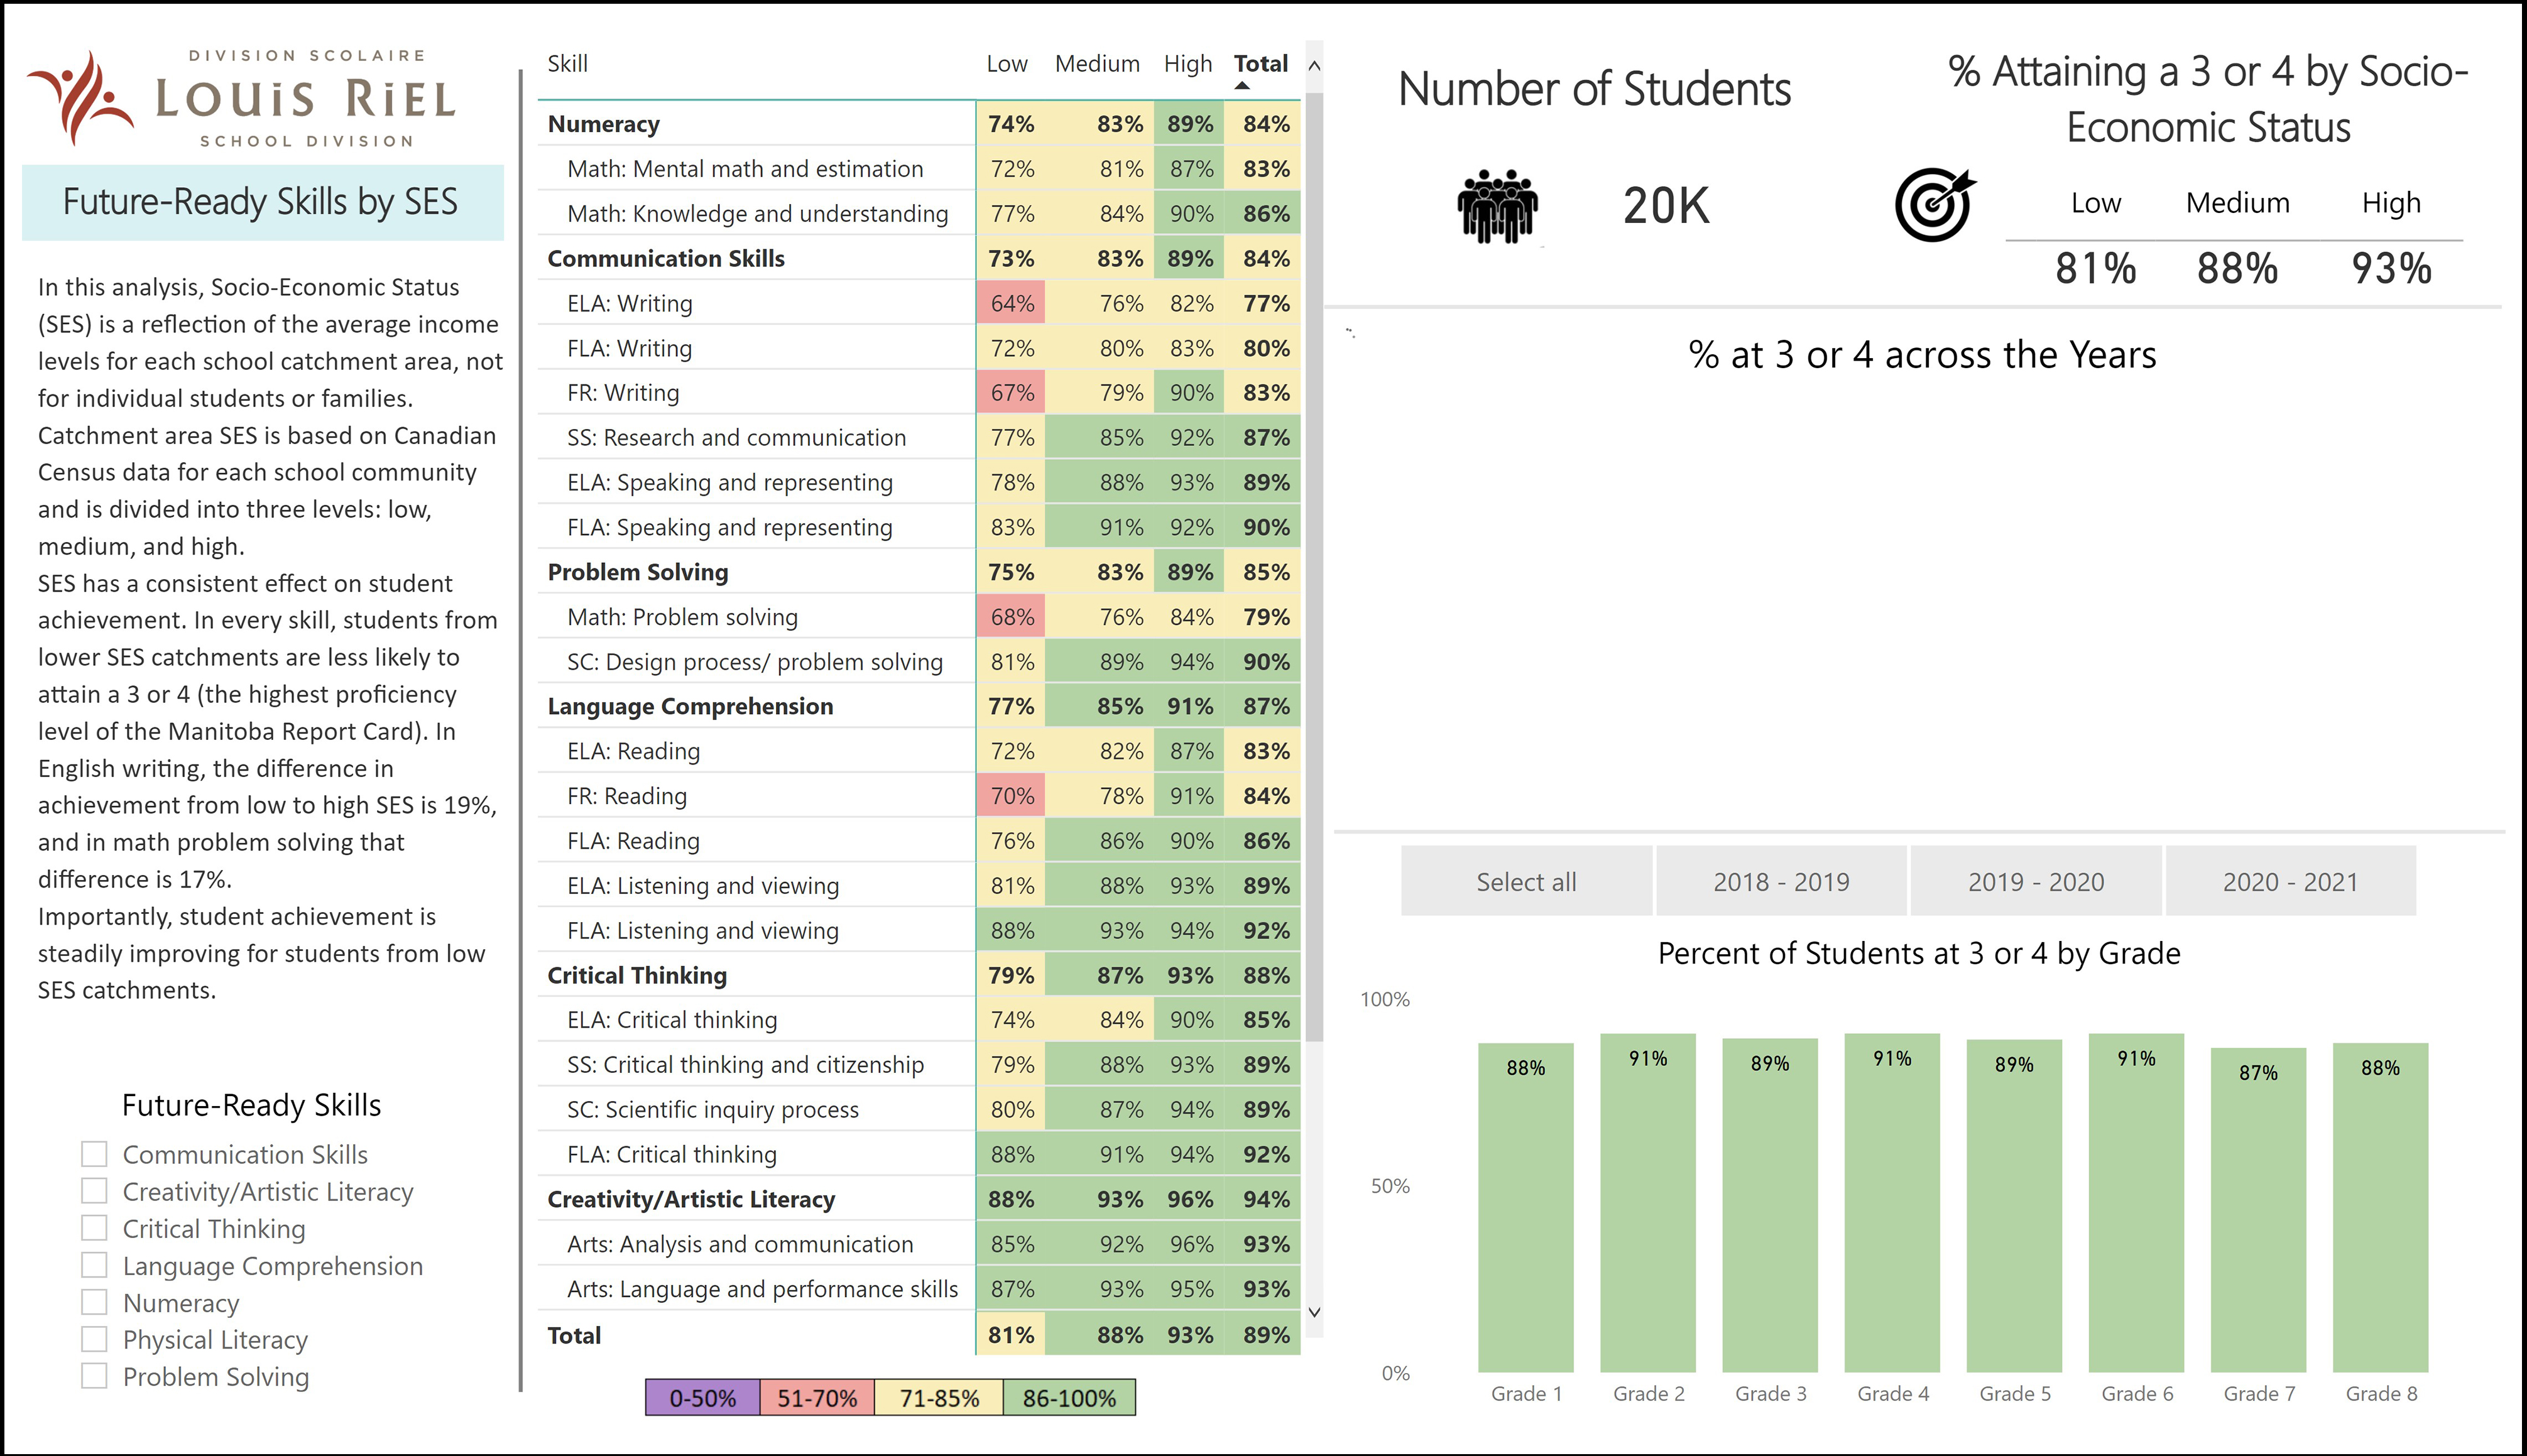
Grades 1 to 8 Future-Ready Skills by Socio-Economic Status
The data also shows that SES has a consistent effect on student achievement. Looking to the skills with the lowest percentage of students attaining proficiency of a 3 or 4, the division's GANs for students in grades 1 to 8 is writing, followed by problem-solving in mathematics. In every skill, students in grades 1 to 8 from lower SES catchments are less likely to obtain a 3 or 4; however, the gap is steadily closing.
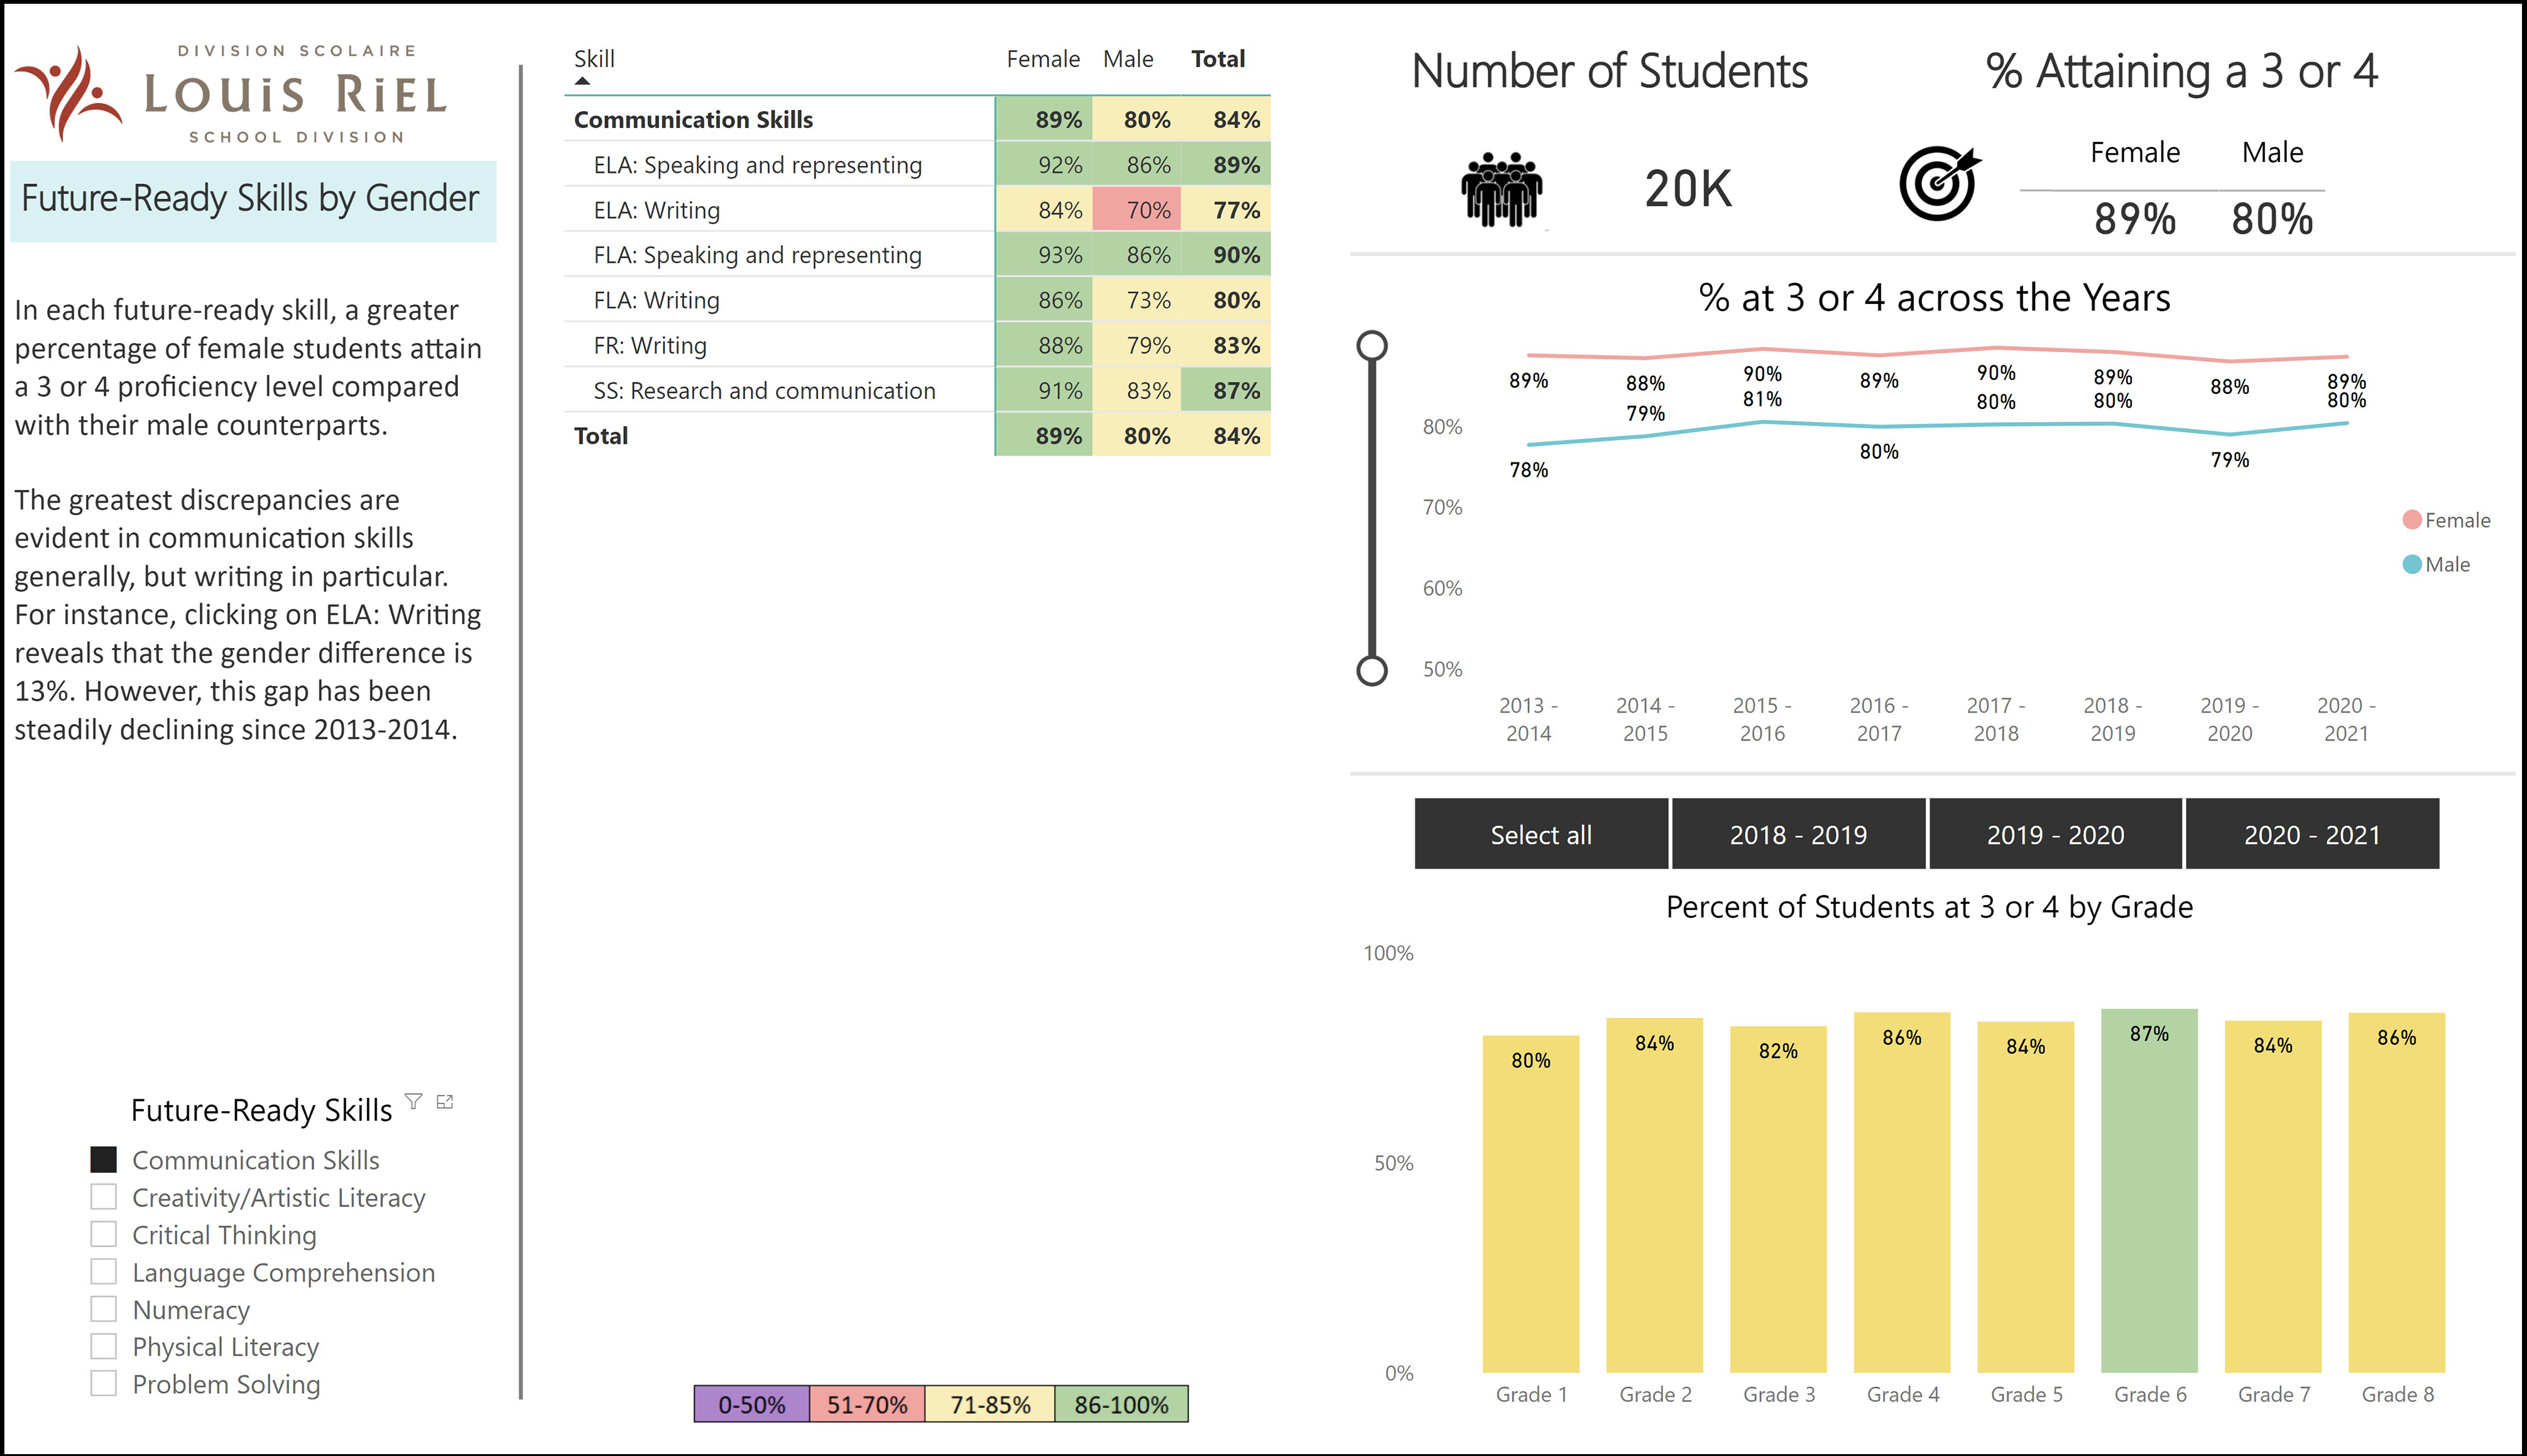
Grades 1 to 8 Future-Ready Skills by Gender
In each future-ready skill, a greater percentage of female students attain a 3 or 4 proficiency level compared with their male counterparts. The greatest discrepancies are evident in communication skills generally, but writing in particular. For instance, clicking on ELA: Writing reveals that the gender difference is 13%. However, the gap has been steadily declining since 2013-2014.
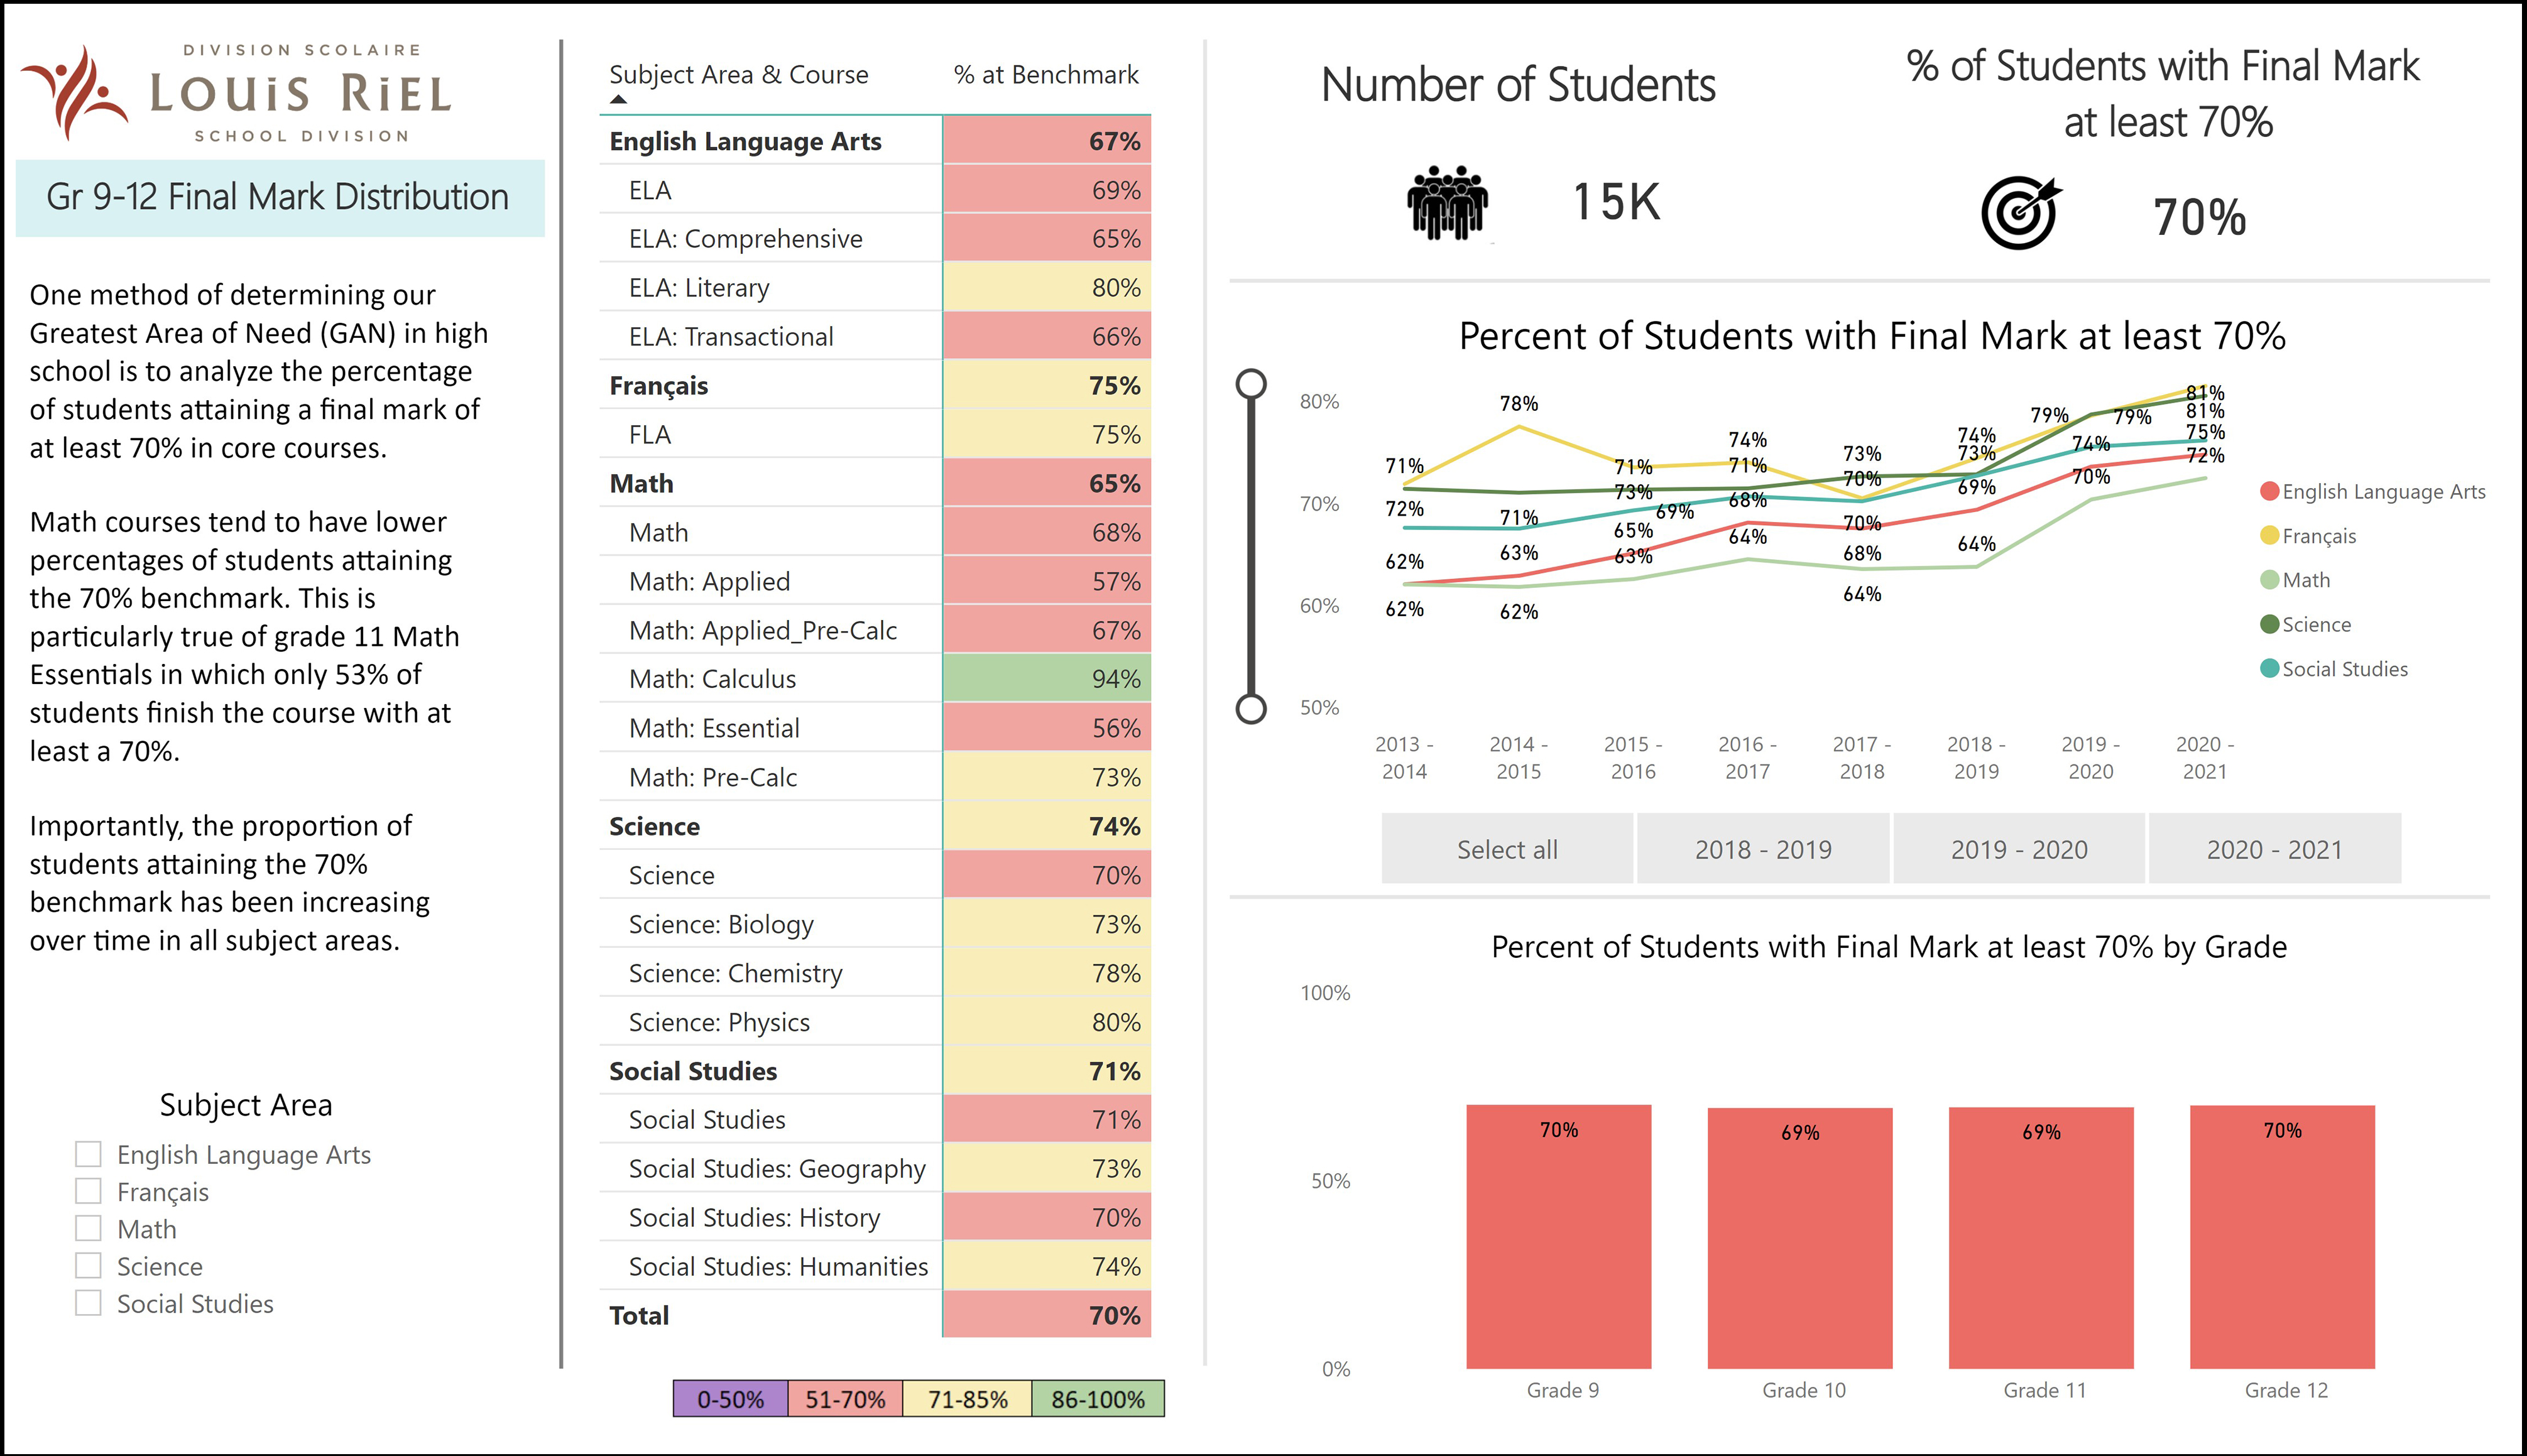
Grade 9 to 12 Final Mark Distribution
Our method in determining our GAN in high school is to analyze the percentage of students attaining a final mark of at least 70% in core courses. Math courses tend to have lower percentages of students attaining the 70% benchmark. This is particularly true of grade 11 Math Essentials, in which only 53% of students finish the course with at least 70%. Importantly, the proportion of students attaining the 70% benchmark has been increasing over time in all subject areas.
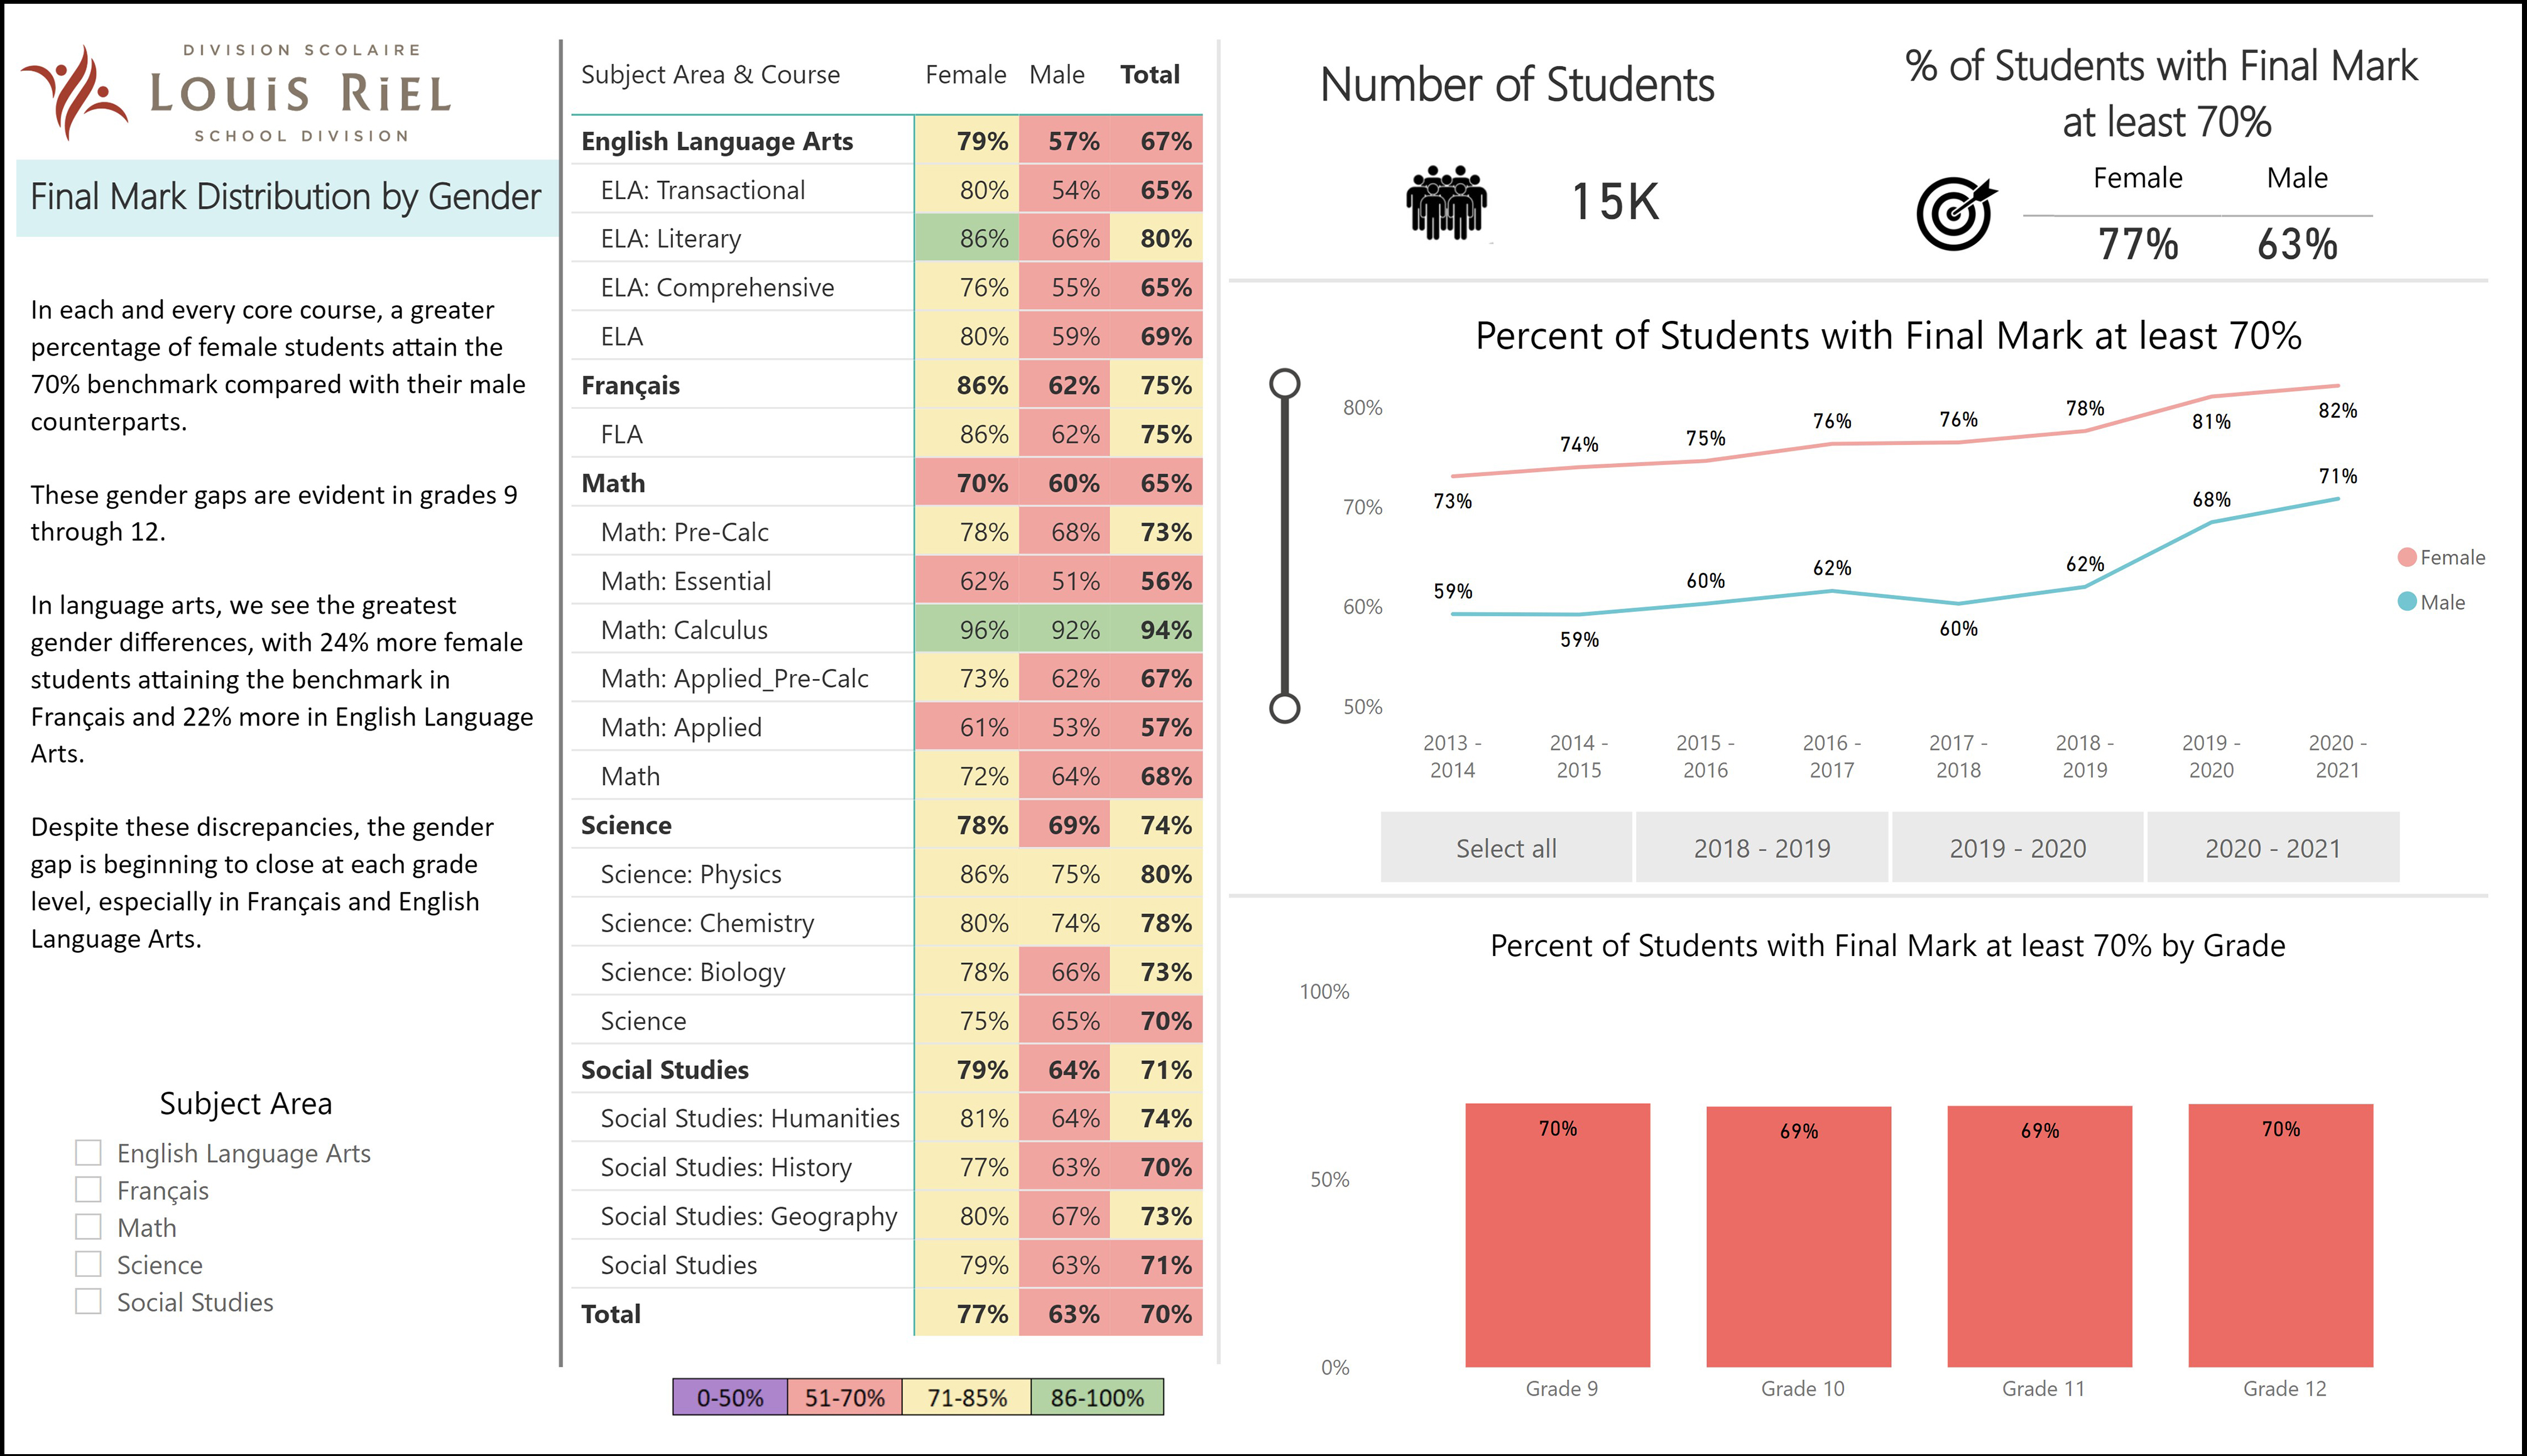
Grade 9 to 12 Final Mark Distribution by Gender
In each and every core course, a greater percentage of female students attain the 70% benchmark compared with their male counterparts. These gender gaps are evident in grades 9 through 12. We see the greatest gender differences in language arts, with 24% more female students attaining the benchmark in Français and 22% more in English Language Arts. Despite these discrepancies, the gender gap is beginning to close at each grade level, especially in Français and English Language Arts.
The data also shows that SES has a consistent effect on student achievement.